FORCED RANKING OF PRODUCT FEATURES IN A SPREADSHEET
One of the most critical skills for any product manager is the ability to quickly make sense of tons of feature requests, bug reports, and business requirements and gel them down to a sane list for the engineers to take action on. In a world where resources are never constrained it might be possible to do everything at once, but we don't live in such a magical realm. All too often I've seen product teams get bogged down by the sense that everything is a top priority. The solution to creating order out of this madness is forced ranking.
In this post I'll share a spreadsheet I've been using for years which, with a little attention, will allow you to quickly parse through the requests and requirements and create an ordered list of priorities for your resources.
What is forced ranking?
Forced ranking is the process of ordering items which might, on the surface, seem of equal weight.
For example, a stakeholder may ask for a product to be:
- responsive for mobile and desktop browsers
- accept credit card payments
- have robust reporting
- have user generated content
Everyone may agree that all four features are critically important but your team of two engineers can only complete one item at a time. This is a prime example of a situation in which creating a force ranked list is appropriate.
The old way of doing this would be to talk through each feature and work to find some agreement on which should come first. These conversations can often be long and exhausting and, more often than not, leave someone unhappy about the outcome. There's a better way. Enter the feature prioritization matrix spreadsheet.
Note: This spreadsheet was originally shared with me years ago. I have heavily edited it and made it my own but I can not claim credit for its inception. If you know who deserves credit, let me know and I'll update the post.
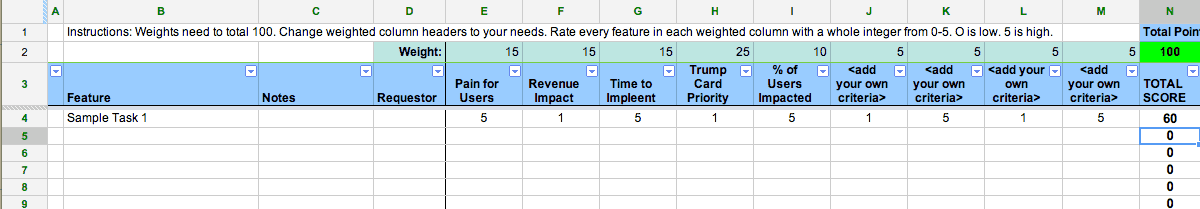
The first three columns are relatively self-explanatory. You have 'Feature', 'Notes', and 'Requestor'. Feel free to add whatever columns you need here to allow you to keep track of the features, ideas, or requirements you want to rank.
The following set of columns (E-M) is where the magic happens. Here you can add your own criteria that you will use to rank your feature. I've gotten you started with some sample columns such as:
- Pain for users
- Revenue impact
- Time to implement
- % users impacted
- Trump Card
You should change these column headers to match your own specific needs and priorities.
Now, once you have your priority column headers in place you need to assign each of them a weight (Row 2). The weights, when added together, need to total 100 for the spreadsheet to work. Using the example columns above you might have:
- Pain for users - Weight 10
- Revenue impact - Weight 30
- Time to implement - Weight 10
- % users impacted - Weight 30
- Trump Card - Weight 20
Lastly, you are going to fill out columns (E-M) with a numerical rank of 0 through 5. Five being the most important and 0 being the least important. So, let's say you have three features you want to rank, your spreadsheet may look like this.
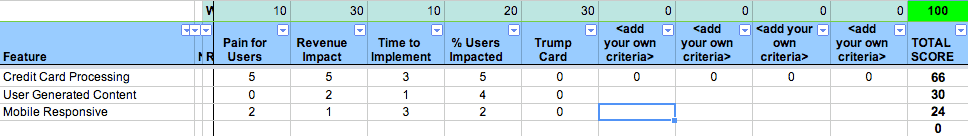
Notice how the far right column 'Total Score' has automatically computed a ranking based on the columns you entered.
Following this example one step further, let's say your CEO put their foot down and said there was nothing more important than the site being mobile responsive. Enter the 'Trump Card' column. Set that value to '5′ and you can see the value shoots up to 54.
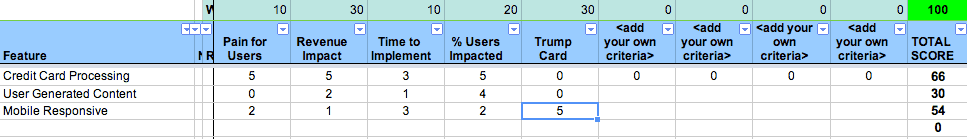
This is where the usefulness of this spreadsheet comes into play. You now have a data driven spreadsheet to show your CEO that still shows it is more important to work on Credit Card processing first even after playing his trump card. He may still override you but at least you've now made a compelling case for what should be the most important feature and you can sleep well at night knowing you've done your job.
I've used this spreadsheet countless times in my career and it's never failed to open my eyes and truly help me sort through brainstorms and requests. After playing with it for a few minutes I am confident it will all make sense.
Note: There is a second sheet included called 'Score Conversion'. This sheet is used for the calculations that drive the Total Score. Don't mess with it unless you know what you're doing.
Don't hesitate to let me know if you have any questions.